View Component Risk
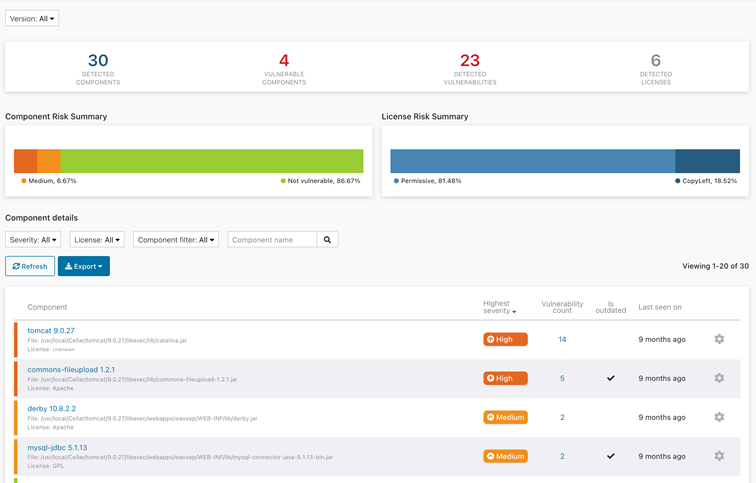
In the Component Risk dashboard, view the application risk reported by Software Composition Analysis (SCA), which scans for vulnerabilities the third-party and open-source components used in your application.
The dashboard
In the main menu, click  (Projects), choose a regular project that you want to view, and click Component
Risk.
In the dashboard that opens, you can view and explore extensive information about the security status of the components used by your application.

Actions
Here is what you can see and do in this dashboard.
| Area | What You See | What You Can Do |
|---|---|---|
| Version filter | A list of the detected versions of your project. | Select which project versions to include. |
| Banner | The overall component statistics for the current project: the numbers of detected components, vulnerable components, detected vulnerabilities, and detected licenses. | Click the number of vulnerable components to filter the Component Details table below by components with vulnerabilities. |
| Component Risk Summary | A stacked bar chart displaying a percentage distribution of components by highest severity levels. | Hover the mouse over the bar to move between the severity levels. Click any area to filter the Component Details table below by the corresponding severity level. |
| License Risk Summary | A stacked bar chart displaying a percentage distribution of components by their license category. | Hover the mouse over the bar to move between the license categories. Click any area to filter the Component Details table below by the corresponding license category: Permissive, Proprietary, LGPL, and CopyLeft. |
Component details
The Component Details section displays the components identified in your application.
| Area | What You Can Do |
|---|---|
| Filters | Set one or more of the following filters for the Component table:
|
| Refresh | Refresh the table according to the current filters. |
| Export | Click Export to export the dashboard content in CSV, JSON, XML, or PDF format. |
| Component table | Sort the table by any of the columns:
|
 (cog) menu (cog) menu |
Open the |
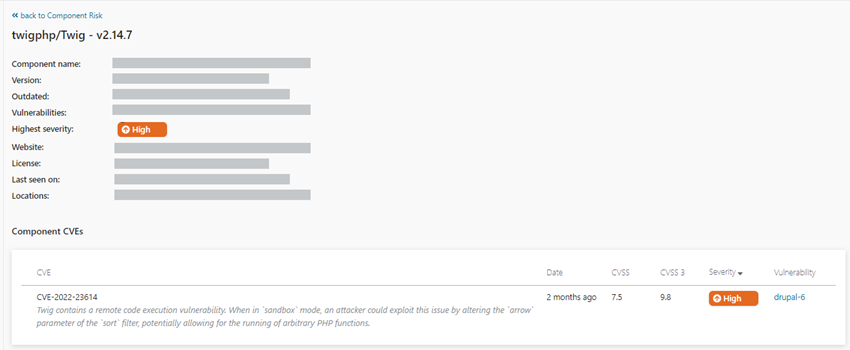
In the table, you can click on any component name to see the detailed information about this component and known vulnerabilities detected in it.

