View and Explore Data Flow Map
In the Data Flow Map dashboard, explore your application's real-time interactions with other resources, such as databases and internal or external services.
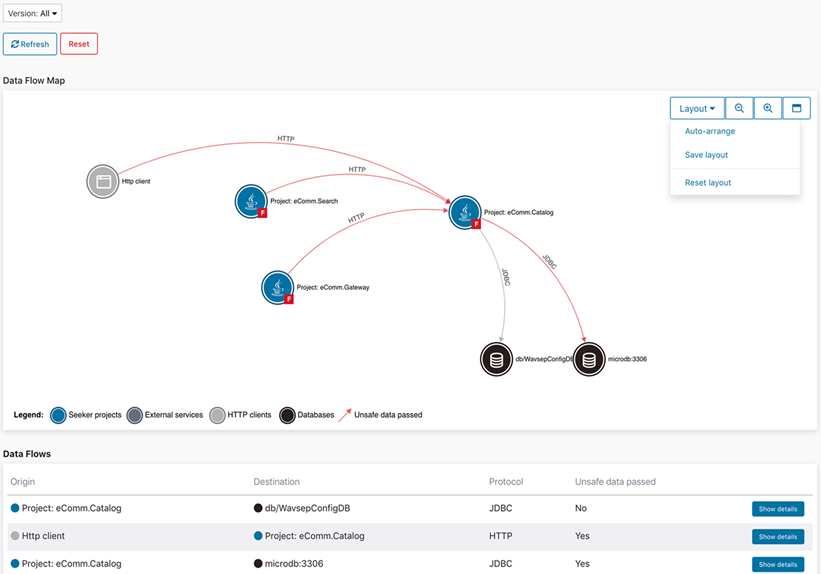
The Data Flow Map is an interactive map that provides a rich and flexible visual representation of the real-time data flows between an application and various resources, such as internal or external services, databases, HTTP clients, and other Seeker projects. This information is gradually collected by Agents when they monitor application activities.
Prerequisites: The Data Flow Map feature is enabled for your project. For instructions, see Configure Data Flow Map.
The dashboard
In the main menu, click  (Projects), choose a project that
you want to view and click Data Flow Map.
Each flow is accompanied by additional visual information, such as arrows indicating the incoming or outgoing direction of data flows between nodes, communication protocol, and the detected passage of unsafe data indicated by red color.

Actions
You can customize and explore the map by doing the following:
- Resize the map or view it in full screen by clicking the
 (zoom)
controls or by using the mouse scroll button.
 - Move and rearrange any map elements for better visibility.
- Auto-arrange the map.
- Save a customized layout and apply it to the future views of the map, or reset the layout.
- Show or hide different categories by clicking the legend.
- Set the project version filter.
- Click Refresh to display the most up-to-date flows.
- Click Reset to clear the current map and gradually rebuild it using the new information collected by the Agents. You might want to do this when the map becomes too densely populated.
- Drill down to the detailed information about any flow by clicking its arrow in
the map or the Show details button in its row in the
table.The Data Flow Details page displays the following:
- The origin and destination of the flow.
- The communication protocol that it uses.
- The detected passage of unsafe data.
- A list of flow samples.
