View Application Security for Composite Projects
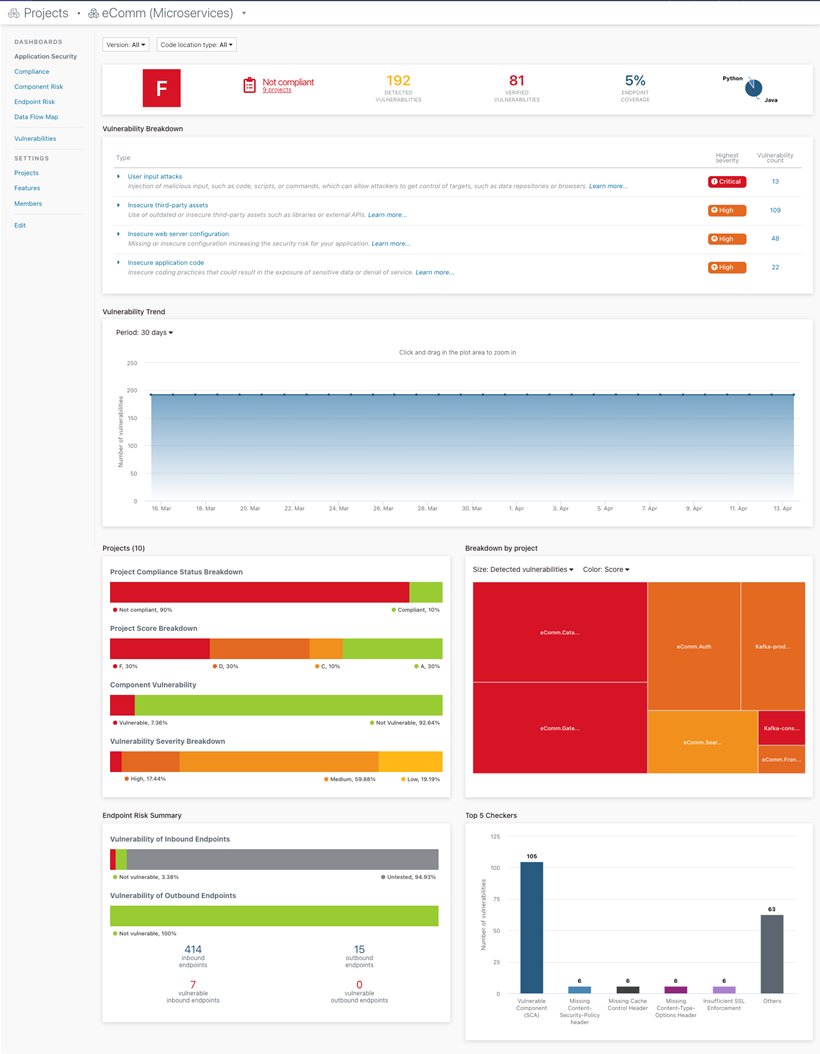
The Application Security dashboard provides an aggregated overview of the vulnerabilities detected in a composite project, which is convenient for assessing the security status of the whole application.
The dashboard
In the main menu, click  (Projects), choose a composite project that you want to view. The
Application Security dashboard opens.

Actions
Here is what you can see and do in this dashboard.
| Area | What You See | What You Can Do |
|---|---|---|
| Page title | Project name | Switch to another project by clicking the arrow next to the name and choosing the required project from the dropdown list. |
| Filters | Dropdown lists of the project versions and code locations. | Set the filters as required. |
| Banner | The overall statistics for the current composite project: the compliance status for the included regular projects, overall numbers of detected and verified vulnerabilities, endpoint coverage, and technology distribution. | Click each number to open the corresponding detailed view. |
| Vulnerability Breakdown | An overview of vulnerabilities grouped by their functional categories. |
|
| Vulnerability Trend | A graph that shows how the overall numbers of detected vulnerabilities change over a period of time. | Choose a period of time from the Period dropdown box: 7/30/90/365 days. |
| Projects | Project breakdowns by compliance status, score, 3rd party components, and vulnerability severity. | Click each line to open the corresponding detailed view. |
| Breakdown by project | A visual distribution of vulnerability counts and scores by included projects. | Click any project's rectangle to switch to that project and open its Application Security dashboard. |
| Endpoint Risk Summary | An overview of vulnerability metrics of inbound and outbound endpoints: the percentage of actually tested endpoints, numbers of found, vulnerable, and untested endpoints. | Click an area, such as Vulnerable, in the Vulnerability of Inbound Endpoints or Vulnerability of Outbound Endpoints bar to open the Endpoint Risk dashboard in the corresponding view. |
| Top 5 Checkers | A bar diagram that shows the distribution of detected vulnerabilities by top 5 checkers. |
