View and Explore Inbound Endpoint Risk
In the Endpoint Risk dashboard, view and explore a distribution of application risk by inbound endpoints.
Inbound endpoints are all the declared or monitored endpoints in an application, such as APIs and application pages, collected by Agents according to the configured collection strategy.
Prerequisites: The Endpoint Discovery feature is enabled for your project. For instructions, see Configure Endpoint Discovery.
The dashboard
In the main menu, click (Projects),
choose a project that you want to view, and click .
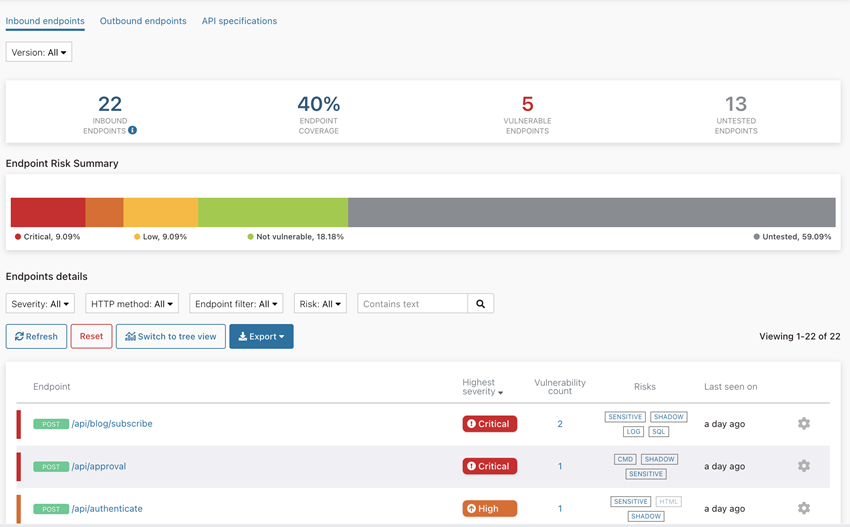
The top banner displays various metrics of inbound endpoints: their overall number, endpoint testing coverage, numbers of vulnerable and untested endpoints. The Endpoint Risk Summary stacked bar chart displays a percentage distribution of endpoint risk by severity.

The Endpoint details section provides a detailed list of endpoints that you can customize and explore.
Customize the endpoint view
You can set various filters, switch between the table and tree views, refresh or reset the view, and export the current content to an external file.
| Action | Instructions |
|---|---|
| Set version filter | Select which project versions to include. Use text search to find versions other than the latest. |
| Set project filter | For composite projects only: select which regular projects to include. |
| Set severity filter | Select which severity levels to include. |
| Set HTTP method filter | Select the HTTP methods by which to filter the request paths, such as GET, PUT, DELETE, and more. |
| Set endpoint filters | Select one or more of the following filters: With sensitive data,
Shadow APIs (undocumented), With vulnerabilities,
Without vulnerabilities, Covered by testing, Covered
by user testing, Covered only by Seeker testing, Not
covered by testing. Note: To get accurate results for the Covered only
by Seeker testing filter, the Active Inspection feature should be enabled
with the Enable inspection of untested endpoints option. For
instructions, see Configure Active Inspection. Note: Shadow (undocumented) APIs will be automatically detected in
your application and displayed here, if the Enable API specification
parsing option is selected. For instructions, see Configure API specification. |
| Set risk filter | Each endpoint, either vulnerable or not, can be marked by one or more tags
indicating a security risk identified for that endpoint or its parameters, such as
SQL, LDAP, SENSITIVE, SHADOW, and more. Select one or more of the risk tags by which to filter the endpoints. |
| Set text filter | Enter a text by which to filter the endpoints. |
| Refresh | Click Refresh to refresh the endpoint view. |
| Reset | Click Reset to clear the endpoint view and gradually rebuild it using the new information collected by the Agents. |
| Switch to tree/table view | Click Switch to tree/table view to switch between the
tree and table view of endpoints. The columns in the endpoint table differ a little for the inbound and outbound endpoints. In the table view (default), you can sort the table by any column by clicking its title. |
| Export | Click Export to export the page content in CSV, JSON, or XML format. |
| Expand/collapse a node | In the tree view, click the + or - icon next to a node to expand or collapse it. |
Explore endpoint details
You can drill down into the smallest details of any endpoint, as well as configure sensitive parameters and exclusion rules for an endpoint or its part.
| Action | Instructions |
|---|---|
| View endpoint details | Click any row in the table or leaf in the tree to view the endpoint details,
such as its path, number of detected vulnerabilities, highest severity, risks, last
detection time, and a list of HTTP parameters. You can filter parameters by severity and
risk. Tip: Click a non-zero value in the Vulnerability
count column or choose See vulnerabilities from
the  (cog) menu to view these
vulnerabilities in the Vulnerabilities page. (cog) menu to view these
vulnerabilities in the Vulnerabilities page. |
| Exclude endpoints | If you have permission to do so, you can exclude certain endpoints or their
parts from the view by configuring exclusion rules on the fly.
Attention: This rule will be added to the list of exclusion rules for
the current project, and will take effect immediately for the current endpoint
view. For more information, see Configure exclusion rules. |
| Configure sensitive parameters | In the Parameters table, mark any parameter as sensitive
or not sensitive for this or for all URLs by clicking the  (cog) icon in its row and toggling
the relevant menu option. You can also customize this sensitive parameter
matcher. (cog) icon in its row and toggling
the relevant menu option. You can also customize this sensitive parameter
matcher. |
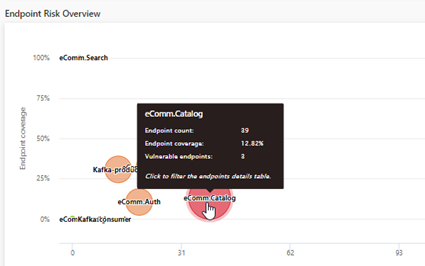
| Explore risks | You can explore risks either from the Endpoint Risk
dashboard or from the endpoint details page. Click a risk tag in the Risks column in the table to open a popup with detailed information about the risk and parameters associated with this risk for the current endpoint. Note: If the risk status for an endpoint or its
parameters is Mitigated, that risk tag would appear disabled in the
endpoint's or parameter's row. |
